ChromaTOF® Sync 1D GC-MS Analytical Software
ChromaTOF® Sync streamlines gas chromatography (GC) analyses by processing sets of one-dimensional GC data files together. Combined peak tables for a sample set allow you to quickly and easily determine trends in your GC data so you can focus less on the what and focus more on the why.
Designed for Comparing Sample Sets
ChromaTOF Sync processes related samples together to produce a combined peak table for the sample set. Optional heatmap tables and various data summary views are incorporated throughout the interface to give instant feedback on relative intensities for analytes across the sample set. You can find analytes that don’t change, that trend in interesting ways, that differentiate groups, and more. ChromaTOF Sync compiles and presents your data in a way that helps you find what you need to know.
- ChromaTOF Sync is a separate, stand-alone product to be used in conjunction with ChromaTOF® brand software.
- All of the tables and plots throughout the interface are exportable for more efficient reporting and to allow you to do more with your data.
- Clean library-searchable spectra is generated from the tiling process.
- Graphical tools such as composite peak tables and PCA plots can draw attention to potential trends across the samples.
The Problem: Comparing sets of chromatograms can be a tedious and lengthy process. With the need to compensate for chromatographic misalignment and count thousands of analytes, even automatic sample identification could take days, weeks, or even months. We needed a way to expedite GC-TOFMS data analysis.
The Solution: Instead of processing every sample independently and comparing all of the separate peak tables, we found that processing the samples together to build a composite peak table streamlined the data review workflow and provided more consistent and reliable results. We’ve made it easy to view your samples together and interact with your data. The ChromaTOF Sync interface shows you what analytes were found and how they compare across the sample set. All the information is in one place.
After essentially averaging the values in a region, our ChromaTOF Tile software compares two corresponding regions to assess the value of difference between these regions. Presented in a graphical means, the software provides users with indicators of low-to-high variance among regions.
These graphic heatmaps quickly and easily draw users’ eyes to areas of high variance, or high interest, reducing the time you spend looking for data outliers. Visually, you can see where the differences are and know what data you should be looking at for your comparisons.
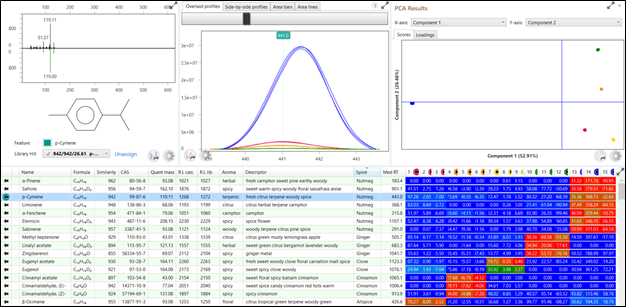
ChromaTOF Sync tells you what analytes were identified in your sample set. You can see the deconvoluted spectrum, library hits, and identification metrics, such as similarity score and retention index, that give you confidence in the analyte identifications. Keep track of notes about the analytes or reference your own databases and import information, like aroma notes, in ChromaTOF Sync’s flexible user-fields to quickly connect what you already know about analytes that were identified in your samples.
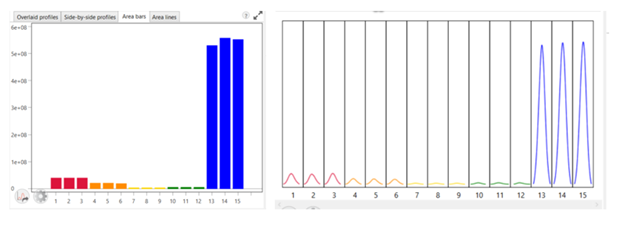
You can choose how you want to explore and view the analyte trends in your data. ChromaTOF Sync offers several options: overlaid chromatograms, heat maps, bar charts, and side-by-side chromatogram views. Tables can be filtered and sorted to quickly discover what you are looking for.
Use ChromaTOF Sync’s additional statistical tools to explore the overall trends in the data with options like PCA and class-comparisons, or easily export your compiled peak table to take it even further.
Whatever your experimental goals, ChromaTOF Sync helps you explore your data and find the information that you need.